ftrace(function tracer)支持全局trace,可以对内核和模块全局函数进行跟踪。tracer为编译器在编译时自动插入代码段的一条指令,程序在运行时能够利用这条指令实现跳转。目前Linux 5.10支持的tracer种类有8种,分别为hwlat、blk、function_graph、wakeup_dl、wakeup_rt、wakeup、function、nop,可以通过/sys/kernel/debug/tracing/available_tracers查看。
GCC允许在编译程序时添加-pg在每一个函数起始处自动插入5个字节的call mcount(ARM64为push rbp)指令,mcount的实现依赖于GLIBC。由于mcount不能记录参数,所以从GCC 4.6开始通过-pg -mfentry将mcount替换为fentry,但是内核中依然使用宏MCOUNT_ADDR来代表GLIBC实现的fentry。如今,内核已经废弃mcount(抱歉,不记得从哪个版本废弃的了)。
编写一个简单程序hello.c做实验:
1
2
3
4
int main() { return 0; }
编译该文件gcc -o hello.o hello.c,然后objdump -S hello.o,可以看到如下形式的经过重定向的汇编代码:
1
2
3
4
5
6
7
8
9
10
11
12
13
14
0000000000401050 <__fentry__@plt>: 401050: ff 25 d2 2f 00 00 jmpq *0x2fd2(%rip) # 404028 <__fentry__@GLIBC_2.13> 401056: 68 02 00 00 00 pushq $0x2 40105b: e9 c0 ff ff ff jmpq 401020 <.plt> 0000000000401196 <main>: 401196: e8 b5 fe ff ff callq 401050 <__fentry__@plt> 40119b: 55 push %rbp 40119c: 48 89 e5 mov %rsp,%rbp 40119f: b8 00 00 00 00 mov $0x0,%eax 4011a4: 5d pop %rbp 4011a5: c3 retq 4011a6: 66 2e 0f 1f 84 00 00 nopw %cs:0x0(%rax,%rax,1) 4011ad: 00 00 00
看到GCC在main函数的起始位置插入了5个bytes的callq指令(汇编opcode为0xfffffeb5e8)。
编译模块时会用到内核源码树中的Makefile和.config文件(实际上是根据.config生成的include/config/auto.conf文件),如果内核源码树中的配置打开了CONFIG_FUNCTION_TRACER,那么在编译模块时也会增加-pg -mfentry,并将影响了的函数地址保存在__mcount_loc段中。
在加载.ko时首先根据模块放置的实际地址为__mcount_loc段重定向,并记录在mod->ftrace_callsites中,最后同样会调用ftrace_process_locs函数来处理(前文有提到该函数)。
如果当前运行的内核打开了CONFIG_FUNCTION_TRACER,但编译module时未打开,实际上编出来的.ko也能加载,只是其中的函数都不支持trace。
ftrace初始化 ftrace实现代码位于kernel/trace/目录下,初始化代码入口是ftrace_init(由init/main.c文件内start_kernel函数调用)。代码如下:
1
2
3
4
5
6
7
8
9
10
11
12
13
14
15
16
17
18
19
20
21
22
23
24
25
26
27
28
29
30
31
32
33
34
35
36
37
void __init ftrace_init (void ) { extern unsigned long __start_mcount_loc[]; extern unsigned long __stop_mcount_loc[]; unsigned long count, flags; int ret; local_irq_save(flags); ret = ftrace_dyn_arch_init(); local_irq_restore(flags); if (ret) goto failed; count = __stop_mcount_loc - __start_mcount_loc; if (!count) { pr_info("ftrace: No functions to be traced?\n" ); goto failed; } pr_info("ftrace: allocating %ld entries in %ld pages\n" , count, count / ENTRIES_PER_PAGE + 1 ); last_ftrace_enabled = ftrace_enabled = 1 ; ret = ftrace_process_locs(NULL , __start_mcount_loc, __stop_mcount_loc); pr_info("ftrace: allocated %ld pages with %ld groups\n" , ftrace_number_of_pages, ftrace_number_of_groups); set_ftrace_early_filters(); return ; failed: ftrace_disabled = 1 ; }
上述代码将将对__start_mcount_loc和__stop_mcount_loc(由内核链接脚本include/asm-generic/vmlinux.lds.h定义的段,放置所有段名为__mcount_loc、__patchable_function_entries的代码)中间的代码段进行特殊处理。有测试数据显示,给函数增加callq\retq指令会带来13%的性能损耗,所以,ftrace初始化时的“特殊处理”就是将插入的指令替换为5 bytes的nop指令,以x86_64为例,大小5个bytes的nop指令为0x0f 1f 44 00 00,同时将这些代码段地址记录下来。
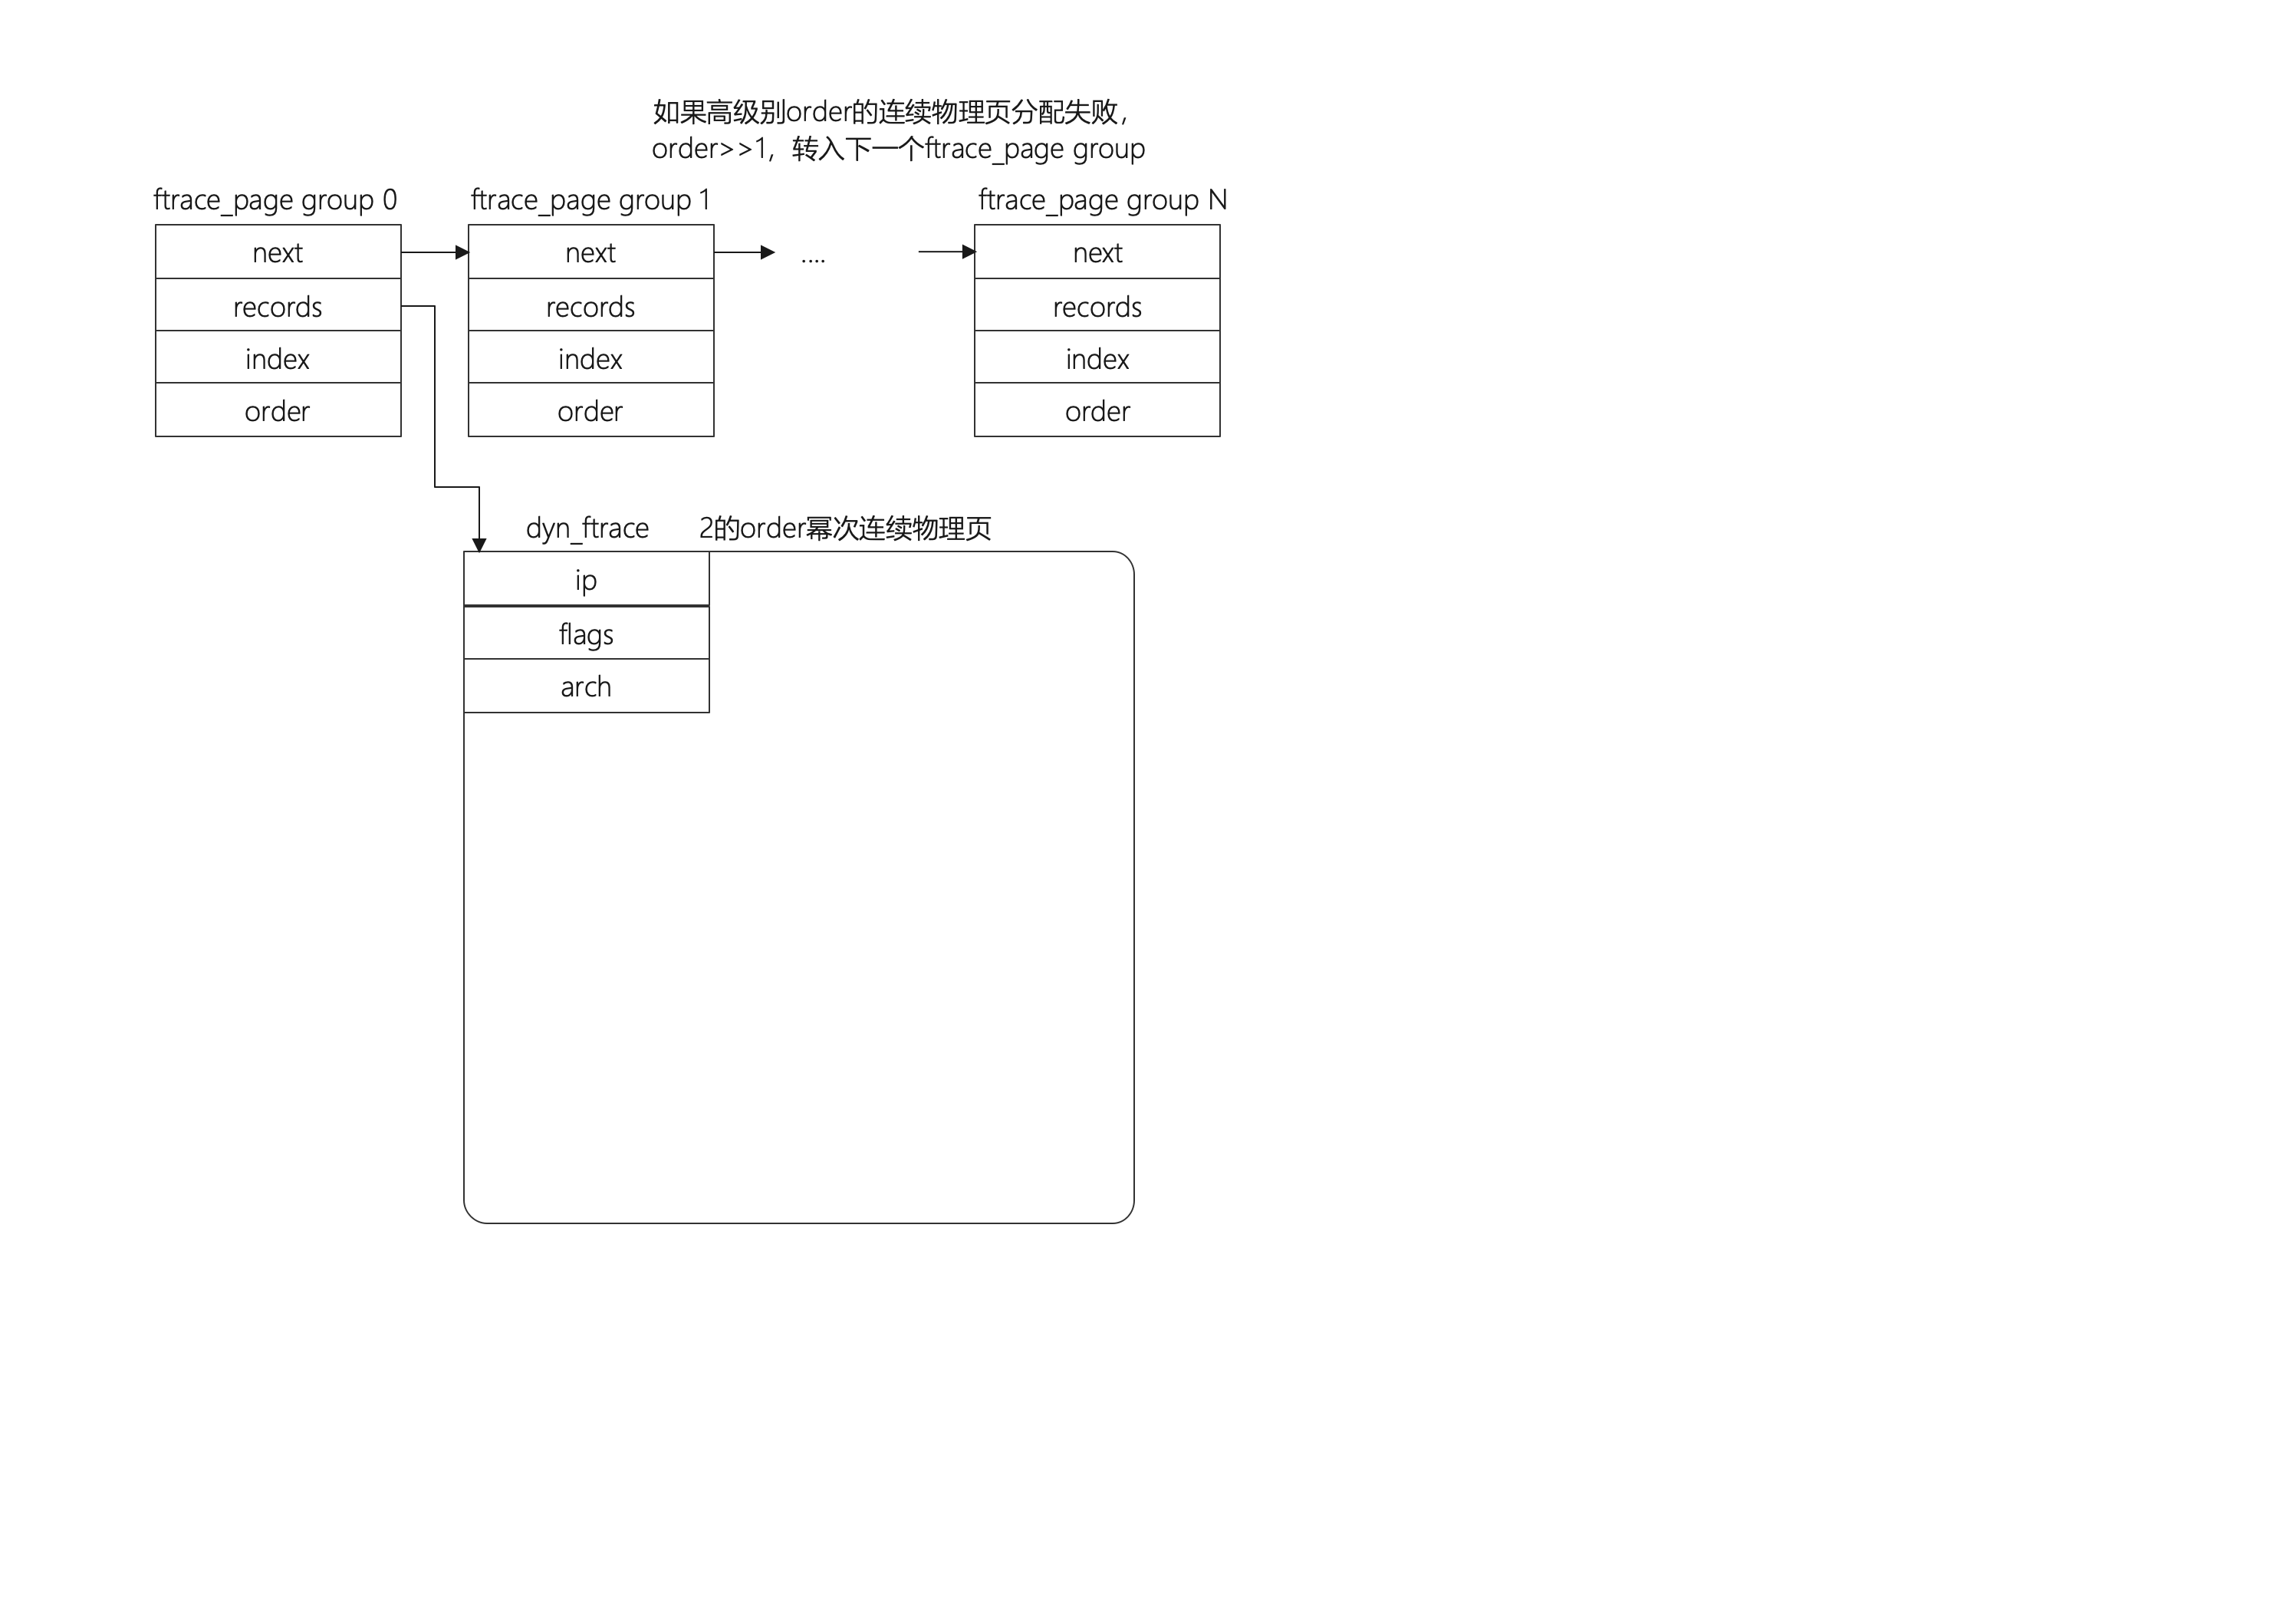
内核记录插入指令的数据结构为struct dyn_ftrace,其中ip存放代码段地址,flags存放标志位(unsigned long,低23位存放该函数注册callback的数量,23位以上存放该函数是否被trace、是否需要保存寄存器等标志位),arch存放不同架构所需的额外数据。整体结构如下入所示:
一个page能够存放的ftrace entry计算方式为PAGE_SIZE / sizeof(struct dyn_ftrace),所需要的ftrace entry的数目为__stop_mcount_loc - __start_mcount_loc,所以总共需要的物理页数量为(__stop_mcount_loc - start_mcount_loc) / (PAGE_SIZE / sizeof(struct dyn_ftrace))向上取整。由于Linux系统内存分配采取伙伴系统,存在order的概念,描述伙伴系统中不同大小的连续物理内存集簇(MAX_ORDER通常为11,所以kmalloc能够分配的最大内存为2^(MAX_ORDER - 1) * PAGE_SIZE = 4MB),ftrace希望能够最大可能占用连续的物理页,所以根据order=tls(page) - 1来尝试从尽可能大的order分配。然而事情有时候不尽如人意,如果分配2^order连续物理页失败,则order = order>>1继续分配,并将拿到的物理页放入下一个ftrace_page group。
最关键的函数是ftrace_make_nop,函数如下:
1
2
3
4
5
6
7
8
9
10
11
12
13
14
15
16
17
18
19
20
21
22
23
24
25
26
int ftrace_make_nop (struct module *mod, struct dyn_ftrace *rec, unsigned long addr) { unsigned long ip = rec->ip; const char *new, *old; old = ftrace_call_replace(ip, addr); new = ftrace_nop_replace(); if (addr == MCOUNT_ADDR) return ftrace_modify_code_direct(ip, old, new); WARN_ONCE(1 , "invalid use of ftrace_make_nop" ); return -EINVAL; }
ftrace_call_replace函数直接调用text_gen_insn,这里是为了拿到代码段ip地址的指令,但是实现逻辑暂时没有搞清楚,据说涉及kernel-5.10新特性static calls,在这里挖个坑,详情参考:https://blog.yossarian.net/2020/12/16/Static-calls-in-Linux-5-10。
以x86_64为例,ftrace_nop_replace找到大小为5个bytes的nop指令,该指令存放在x86_nops全局数组中,直接返回x86_nops[5]即可,x86_nops[5]通过一系列的数组和宏解析,最终返回的结果0x0f 1f 44 00 00,对应的nop指令为nopl 0x00(%eax, %eax, 1)。具体实现如下:
1 2 3 4 5 6 7 8 9 10 11 12 13 14 15 16 17 18 19 20 21 22 23 24 25 26 27 28 29 30 31 32 33 34 35 36 37 38 39 40 41 42 43 44 45 #define BYTES_NOP1 0x90 #define BYTES_NOP2 0x66,BYTES_NOP1 #define BYTES_NOP3 0x0f,0x1f,0x00 #define BYTES_NOP4 0x0f,0x1f,0x40,0x00 #define BYTES_NOP5 0x0f,0x1f,0x44,0x00,0x00 #define BYTES_NOP6 0x66,BYTES_NOP5 #define BYTES_NOP7 0x0f,0x1f,0x80,0x00,0x00,0x00,0x00 #define BYTES_NOP8 0x0f,0x1f,0x84,0x00,0x00,0x00,0x00,0x00 const unsigned char x86nops[] ={ BYTES_NOP1, BYTES_NOP2, BYTES_NOP3, BYTES_NOP4, BYTES_NOP5, BYTES_NOP6, BYTES_NOP7, BYTES_NOP8, }; const unsigned char * const x86_nops[ASM_NOP_MAX+1 ] ={ NULL , x86nops, x86nops + 1 , x86nops + 1 + 2 , x86nops + 1 + 2 + 3 , x86nops + 1 + 2 + 3 + 4 , x86nops + 1 + 2 + 3 + 4 + 5 , x86nops + 1 + 2 + 3 + 4 + 5 + 6 , x86nops + 1 + 2 + 3 + 4 + 5 + 6 + 7 , };
ftrace_modify_code_direct将相应代码段地址的指令替换为新的5个bytes大小的nop指令。至此ftrace_init基本完成。
ftrace主要框架构成 ring buffer ftrace可以支持多种tracer,ring buffer用来存放tracer触发的数据,per_cpu的结构。此外,还有以下特性:
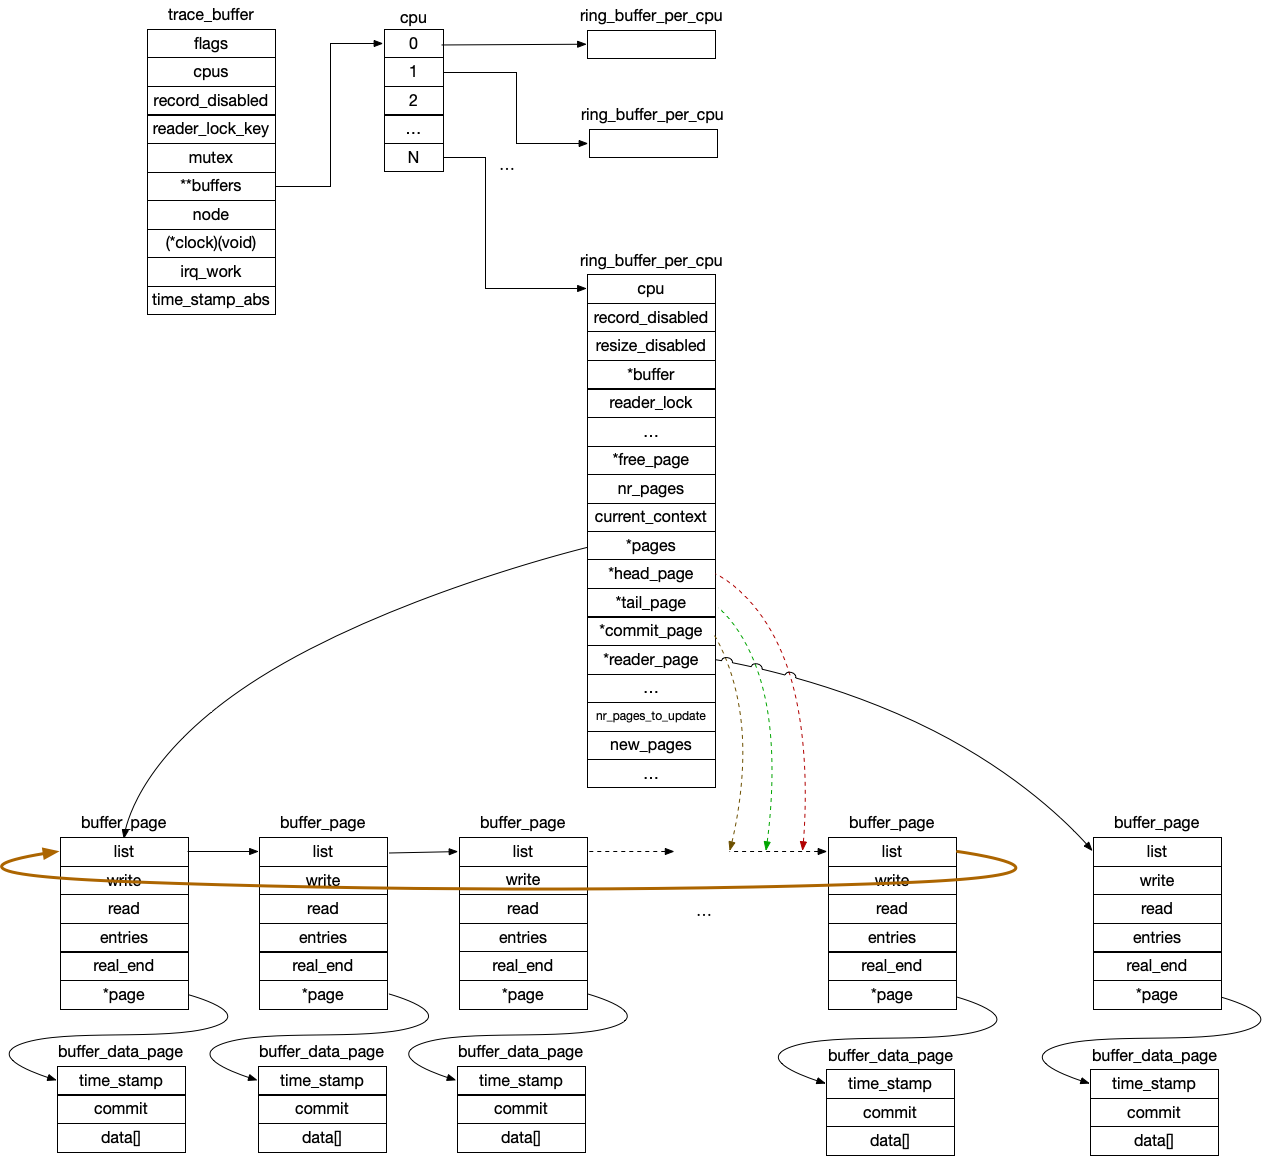
struct ring_buffer_per_cpu根据size来分配buffer_page,并将这些pages通过list_head链接成环,这就是“ring”的由来buffer_page仅是一个控制结构,真正的page是struct buffer_data_page,用来存放数据。data[]数据空间通过struct ring_buffer_event控制格式struct ring_buffer_per_cpu通过head_page(头指针\读)、tail_page(尾指针\写)、commit_page(写确认)来管理ring;同理buffer_page->write、buffer_page->read、buffer_data_page->commit来管理page内偏移量ring_buffer_per_cpu->reader_page还包含一个单独的buffer_page,用以支持reader方式的读方式
ring buffer结构如下图所示:
ring buffer初始化函数是early_trace_init,同样由init/main.c文件内start_kernel函数调用。详细函数调用流程如下:
start_kernel->early_trace_init->tracer_alloc_buffers->ring_buffer_alloc->__ring_buffer_alloc:
1 2 3 4 5 6 7 8 9 10 11 12 13 14 15 16 17 18 19 20 21 22 23 24 25 26 27 28 29 30 31 32 33 34 35 36 37 38 39 40 41 42 43 44 45 46 47 48 49 50 51 52 53 54 55 56 57 58 59 60 61 62 63 64 65 66 67 68 69 70 71 72 73 74 75 76 77 struct trace_buffer *__ring_buffer_alloc (unsigned long size , unsigned flags , struct lock_class_key *key ) { struct trace_buffer *buffer ; long nr_pages; int bsize; int cpu; int ret; buffer = kzalloc(ALIGN(sizeof (*buffer), cache_line_size()), GFP_KERNEL); if (!buffer) return NULL ; if (!zalloc_cpumask_var(&buffer->cpumask, GFP_KERNEL)) goto fail_free_buffer; nr_pages = DIV_ROUND_UP(size, BUF_PAGE_SIZE); buffer->flags = flags; buffer->clock = trace_clock_local; buffer->reader_lock_key = key; init_irq_work(&buffer->irq_work.work, rb_wake_up_waiters); init_waitqueue_head(&buffer->irq_work.waiters); if (nr_pages < 2 ) nr_pages = 2 ; buffer->cpus = nr_cpu_ids; bsize = sizeof (void *) * nr_cpu_ids; buffer->buffers = kzalloc(ALIGN(bsize, cache_line_size()), GFP_KERNEL); if (!buffer->buffers) goto fail_free_cpumask; cpu = raw_smp_processor_id(); cpumask_set_cpu(cpu, buffer->cpumask); buffer->buffers[cpu] = rb_allocate_cpu_buffer(buffer, nr_pages, cpu); if (!buffer->buffers[cpu]) goto fail_free_buffers; ret = cpuhp_state_add_instance(CPUHP_TRACE_RB_PREPARE, &buffer->node); if (ret < 0 ) goto fail_free_buffers; mutex_init(&buffer->mutex); return buffer; fail_free_buffers: for_each_buffer_cpu(buffer, cpu) { if (buffer->buffers[cpu]) rb_free_cpu_buffer(buffer->buffers[cpu]); } kfree(buffer->buffers); fail_free_cpumask: free_cpumask_var(buffer->cpumask); fail_free_buffer: kfree(buffer); return NULL ; } EXPORT_SYMBOL_GPL(__ring_buffer_alloc);
其中代码流程都很常规,需要注意一些小trick:
很多时候分配内存都是cache_line_size对齐,这是由于涉及per_cpu类型的数据都要尤其注意,缓存行对齐防止不必要的访存。
仅针对当前cpu(通过raw_smp_processor_id()获取)分配ring buffer,最初的实现是针对每一个cpu同时创建ring buffer,由于当前内核还没有初始化sched和irq,我认为由当前cpu为其它cpu分配ring buffer确实有点不太合理。最新的实现新增了一个cpu状态CPUHP_TRACE_RB_PREPARE,调用cpuhp_setup_state_multi(CPUHP_TRACE_RB_PREPARE, "trace/RB:prepare", trace_rb_cpu_prepare, NULL)为该状态注册一个callback函数,然后调用cpuhp_state_add_instance(CPUHP_TRACE_RB_PREPARE, &buffer->node)显示触发CPUHP_TRACE_RB_PREPARE。这一修改参见:https://www.mail-archive.com/linux-kernel@vger.kernel.org/msg1280988.html
ring buffer是trace机制的基础,用来记录tracer信息。而ftrace可能发生在不同的上下文中执行(可能是正常进程上下文、终端、NMI等),所以需要对ring buffer进行互斥访问。但是又由于ftrace不能给正常的内核业务带来过大的开销,引入了无锁的设计。为了支持nested-write嵌套写的免锁操作,引入commit的概念。这里是整个ring buffer设计的精髓。为了防止误导各位同学,这里不做解读。具体设计参加linux官方文档:https://www.kernel.org/doc/Documentation/trace/ring-buffer-design.txt
ftracefs ftrace是内核的机制,用户需要利用该机制进行内核调试、性能分析等,所以内核提供ftracefs给用户提供定制化ftrace服务、呈现结果。
ftracefs通过三大类呈现,分别是tracer、filter_functions、event。上文提到目前Linux 5.10支持的tracer种类有8种,分别为hwlat、blk、function_graph、wakeup_dl、wakeup_rt、wakeup、function、nop,选取function_graph为例来查看open系统调用的调用流程。
通过ftracefs进入如下设置:
1
2
3
4
5
echo 0 > /sys/kernel/debug/tracing/tracing_on #关闭trace echo function_graph > /sys/kernel/debug/tracing/current_tracer #设置跟踪函数调用栈 echo 1 > /sys/kernel/debug/tracing/tracing_on #打开trace ls #触发open系统调用 echo 0 > /sys/kernel/debug/tracing/tracing_on #关闭trace
查看文件/sys/kernel/debug/tracing/trace,所有信息都是从ring buffer读取,由于是无锁的,在对function_graph做trace时需要确保没有其他的event干扰。可以显示open系统调用的调用链、执行CPU、函数耗时。如下所示,
1
2
3
4
5
6
7
8
9
10
11
12
13
14
15
16
17
18
19
20
21
22
23
24
25
26
27
28
29
30
31
32
33
34
35
36
37
38
39
40
41
42
43
44
45
46
47
48
49
50
51
52
53
54
55
56
57
58
59
60
61
62
63
64
65
66
67
68
69
70
71
72
73
74
75
76
77
78
79
80
81
82
83
84
85
86
87
88
89
90
91
92
93
94
95
96
97
98
99
100
101
102
103
104
105
106
107
108
109
110
111
112
113
114
115
116
117
118
119
120
121
122
123
124
125
126
127
128
129
130
131
132
133
134
135
136
137
138
139
140
141
142
143
144
145
146
147
# tracer: function_graph # # CPU DURATION FUNCTION CALLS # | | | | | | | 0) | __x64_sys_openat() { 0) | do_sys_openat2() { 0) | getname() { 0) | getname_flags.part.0() { 0) | kmem_cache_alloc() { 0) 0.181 us | should_failslab(); 0) 0.530 us | } 0) | __check_object_size() { 0) | __check_object_size.part.0() { 0) 0.198 us | check_stack_object(); 0) 0.181 us | __virt_addr_valid(); 0) 0.186 us | __check_heap_object(); 0) 1.234 us | } 0) 1.553 us | } 0) 2.630 us | } 0) 2.954 us | } 0) | get_unused_fd_flags() { 0) | __alloc_fd() { 0) 0.380 us | _raw_spin_lock(); 0) 0.177 us | expand_files(); 0) 1.397 us | } 0) 1.802 us | } 0) | do_filp_open() { 0) | path_openat() { 0) | alloc_empty_file() { 0) | __alloc_file() { 0) | kmem_cache_alloc() { 0) 0.177 us | should_failslab(); 0) 0.866 us | } 0) | security_file_alloc() { 0) | kmem_cache_alloc() { 0) 0.177 us | should_failslab(); 0) 0.962 us | } 0) 1.310 us | } 0) 0.176 us | __mutex_init(); 0) 3.432 us | } 0) 3.932 us | } 0) | path_init() { 0) | nd_jump_root() { 0) 0.176 us | set_root(); 0) 0.511 us | } 0) 0.868 us | } 0) | link_path_walk.part.0() { 0) | inode_permission.part.0() { 0) 0.204 us | generic_permission(); 0) 0.179 us | security_inode_permission(); 0) 0.883 us | } 0) | walk_component() { 0) | lookup_fast() { 0) 0.236 us | __d_lookup_rcu(); 0) 0.859 us | } 0) | step_into() { 0) 0.180 us | __follow_mount_rcu(); 0) 0.521 us | } 0) 1.952 us | } 0) | inode_permission.part.0() { 0) 0.177 us | generic_permission(); 0) 0.180 us | security_inode_permission(); 0) 1.010 us | } 0) | walk_component() { 0) | lookup_fast() { 0) 0.376 us | __d_lookup_rcu(); 0) 0.738 us | } 0) | step_into() { 0) 0.182 us | __follow_mount_rcu(); 0) 0.521 us | } 0) 1.768 us | } 0) | inode_permission.part.0() { 0) 0.182 us | generic_permission(); 0) 0.176 us | security_inode_permission(); 0) 0.846 us | } 0) 7.724 us | } 0) | open_last_lookups() { 0) | lookup_fast() { 0) 0.184 us | __d_lookup_rcu(); 0) 0.518 us | } 0) | step_into() { 0) 0.179 us | __follow_mount_rcu(); 0) 0.513 us | } 0) 1.525 us | } 0) | do_open() { 0) | complete_walk() { 0) | try_to_unlazy() { 0) 0.181 us | legitimize_links(); 0) | __legitimize_path() { 0) 0.184 us | __legitimize_mnt(); 0) 0.527 us | } 0) 0.179 us | legitimize_root(); 0) 0.179 us | rcu_read_unlock_strict(); 0) 1.883 us | } 0) 2.212 us | } 0) | may_open() { 0) | inode_permission() { 0) | inode_permission.part.0() { 0) 0.199 us | generic_permission(); 0) 0.179 us | security_inode_permission(); 0) 0.856 us | } 0) 1.174 us | } 0) 1.543 us | } 0) | vfs_open() { 0) | do_dentry_open() { 0) | path_get() { 0) 0.180 us | mntget(); 0) 0.512 us | } 0) 0.180 us | try_module_get(); 0) | security_file_open() { 0) 0.327 us | __fsnotify_parent(); 0) 0.722 us | } 0) | ext4_file_open [ext4]() { 0) 0.249 us | ext4_sample_last_mounted [ext4](); 0) | dquot_file_open() { 0) 0.239 us | generic_file_open(); 0) 0.707 us | } 0) 1.597 us | } 0) 0.744 us | file_ra_state_init(); 0) 5.942 us | } 0) 6.365 us | } 0) | ima_file_check() { 0) 0.326 us | security_task_getsecid(); 0) 0.216 us | process_measurement(); 0) 1.161 us | } 0) + 12.117 us | } 0) | terminate_walk() { 0) | dput() { 0) 0.182 us | rcu_read_unlock_strict(); 0) 0.525 us | } 0) | mntput() { 0) | mntput_no_expire() { 0) 0.179 us | rcu_read_unlock_strict(); 0) 0.518 us | } 0) 0.843 us | } 0) 1.851 us | } 0) + 29.215 us | } 0) + 29.607 us | } 0) 0.198 us | __fsnotify_parent(); 0) | fd_install() { 0) 0.178 us | __fd_install(); 0) 0.569 us | } 0) | putname() { 0) 0.187 us | kmem_cache_free(); 0) 0.593 us | } 0) + 37.556 us | } 0) + 38.021 us | }